Net-Zero Homes and Carbon Footprint: Reduce CO2 by 80% with These Upgrades
The Environmental Crisis at Your Doorstep
Canadian homes are responsible for 17% of the country's greenhouse gas emissions. The average Canadian household produces 15.6 tonnes of CO2 equivalent annually just from home energy use. But what if you could eliminate 80% or more of that footprint while saving money?
Understanding Your Home's Carbon Impact
Current Canadian Home Emissions
Heating: 9.8 tonnes CO2/year (63% of home emissions)
Electricity: 3.2 tonnes CO2/year (20% of home emissions)
Hot Water: 1.8 tonnes CO2/year (12% of home emissions)
Other Appliances: 0.8 tonnes CO2/year (5% of home emissions)Regional Variations
Carbon intensity varies significantly across Canada:
Alberta: 820 kg CO2/MWh (coal/gas grid)
Ontario: 30 kg CO2/MWh (nuclear/hydro grid)
Quebec: 1.5 kg CO2/MWh (hydro grid)
Saskatchewan: 730 kg CO2/MWh (coal grid)Net-Zero Transformation: The Path to Carbon Freedom
Phase 1: Eliminate Fossil Fuel Heating (70% Reduction)
Traditional Gas Furnace Replacement
Before: Natural gas heating produces 2.3 kg CO2 per cubic meter
After: Electric heat pump powered by renewable energy
CO2 Reduction: 9.8 tonnes/year → 0.5 tonnes/year
Environmental Impact: Equivalent to planting 220 trees annuallyPhase 2: Solar Energy Generation (95% Grid Independence)
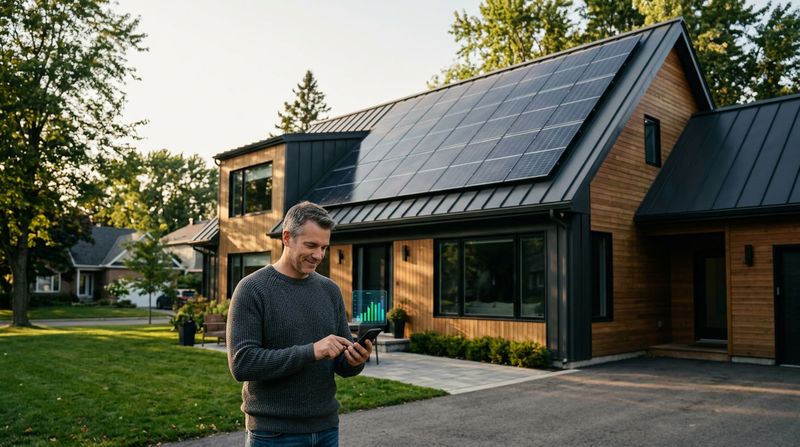
Rooftop Solar Installation
8kW Solar System: Generates 10,000-12,000 kWh annually
Grid Offset: Covers 100%+ of typical home electricity needs
Carbon Elimination: 3.2 tonnes CO2/year in grid-dependent regions
Surplus Generation: Often produces 20% more than home consumesPhase 3: Energy Efficiency Maximization
Comprehensive Building Envelope
Advanced Insulation: R-40 walls, R-60 attics reduce heating needs by 60%
Triple-Pane Windows: Eliminate thermal bridges and air leakage
Air Sealing: Achieve 1.5 ACH50 or better (Passive House standards)
Smart Systems: AI-driven energy management optimizes consumptionReal-World Carbon Reduction Case Studies
Case Study 1: Calgary Family Home
Before Net-Zero Upgrades:
Annual Energy Use: 25,000 kWh + 2,800 cubic meters natural gas
Carbon Footprint: 18.2 tonnes CO2/year
Monthly Energy Bills: $420After Net-Zero Transformation:
Annual Energy Use: 12,000 kWh (100% solar generated)
Carbon Footprint: 0.8 tonnes CO2/year (manufacturing offset only)
Monthly Energy Bills: $15 (connection fees)
CO2 Reduction: 96% (17.4 tonnes eliminated annually)Case Study 2: Toronto Townhouse
Before Upgrades:
Reliance on Ontario grid (low carbon) + gas heating
Carbon Footprint: 12.1 tonnes CO2/year
Energy Costs: $280/monthAfter Net-Zero Implementation:
Heat pump + solar system + efficiency upgrades
Carbon Footprint: 1.2 tonnes CO2/year
Energy Costs: $8/month
CO2 Reduction: 90% (10.9 tonnes eliminated annually)The Ripple Effect: Beyond Your Home
Community Impact Multiplication
When you go net-zero, your impact extends beyond your property:
Grid Stability: Solar generation supports neighborhood energy needs
Market Transformation: Increased demand drives renewable technology costs down
Social Influence: Neighbors are 4x more likely to install solar after seeing your system
Local Economy: Job creation in renewable energy sectorLifetime Environmental Impact
Over 25 years, a net-zero home prevents:
CO2 Elimination: 435 tonnes (equivalent to driving 1.1 million km less)
Tree Equivalent: Impact of planting 5,500 trees
Coal Offset: Prevents burning 217 tonnes of coal
Water Conservation: Saves 2.1 million liters through reduced power plant cooling needsBeyond Carbon: Additional Environmental Benefits
Air Quality Improvement
Net-zero homes eliminate indoor air pollution from:
Gas Furnaces: No combustion byproducts or carbon monoxide risk
Improved Ventilation: HRV/ERV systems ensure fresh air circulation
Reduced Particulates: Electric systems produce no local emissionsResource Conservation
Water Usage: Heat pump hot water systems use 60% less energy
Material Longevity: High-efficiency equipment lasts 2-3x longer
Waste Reduction: Minimal maintenance requirements reduce disposal needsGovernment Recognition and Support
Canada's Net-Zero Commitment Alignment
Your home transformation supports national climate goals:
2030 Target: 40-45% emissions reduction below 2005 levels
2050 Goal: Net-zero emissions economy-wide
Building Sector: Must achieve 37% emissions reduction by 2030Available Environmental Incentives
Carbon Pricing Benefits: Avoid carbon tax increases on fossil fuel use
Green Building Certifications: LEED, ENERGY STAR, Passive House recognition
Municipal Rebates: Many cities offer additional incentives for carbon reduction
Utility Programs: Time-of-use rates favor solar generation patternsMaking the Environmental Case
Comparing Transportation Impact
Your net-zero home transformation has equivalent environmental impact to:
Eliminating 2 cars: Average vehicles produce 8.8 tonnes CO2/year each
1,100 flights: Toronto to Vancouver round trips
Plant 435 trees: Annual carbon sequestration equivalentCost Per Tonne of CO2 Eliminated
Net-Zero Investment: $40,000 typical
CO2 Eliminated: 15 tonnes/year × 25 years = 375 tonnes
Cost Per Tonne: $107/tonne CO2 (including financial savings)
Market Comparison: Carbon credits trade at $30-80/tonneThe Path Forward: Your Carbon Elimination Plan
Step 1: Energy Assessment (Week 1-2)
Professional home energy audit
Carbon footprint baseline calculation
Prioritization of high-impact upgradesStep 2: Systematic Upgrades (Months 1-6)
Insulation and air sealing first
Heat pump installation second
Solar system installation final phaseStep 3: Performance Monitoring (Ongoing)
Real-time energy and carbon tracking
Quarterly performance reviews
Continuous optimization opportunitiesThe Urgency of Action
Climate scientists agree we have less than 7 years to halve global emissions. Your home transformation isn't just an investment—it's climate action that:
Eliminates 15+ tonnes CO2 annually
Demonstrates leadership in your community
Saves $3,000-5,000 per year in energy costs
Increases property value by $25,000-50,000
Creates a healthier living environment for your familyReady to eliminate your home's carbon footprint? Plan your upgrades with our Build My System tool or get a personalized assessment to start your transformation today.